First: Why am I online?
1. I want my social media accounts to show that I know what I am doing as a hopeful social media coordinator.
2. I want to highlight that I have a healthy social life while balancing it with responsible studies and work.
3. I want to have engaging and relevant content posted on a semi-regular basis for my audience.
However, I have two main audiences that I am split between on social media.
-> Professional connections and potential employers
I want to appear well-rounded but mainly want to highlight my professional content and tone. For this audience, I don’t want to appear superfluous or easily distracted, so I try to put a lot of thought into what I post and how I want it to appear.
-> My friends
The majority of my friends don't care about public relations and I don’t want to bore them with unnecessary content. The things I create and share for this audience include fun posts about my life and showing how I interact with my friends in real life.
Second: What do I post?
I am active on several social media platforms.
My Twitter account is geared toward my professional connections and potential employers.
On this platform, I almost never post anything about my life, instead posting semi-regularly with a professional tone about relevant content to my spheres of influence: social media, Texas Tech, digital marketing, public relations, etc.
My Facebook, Instagram and Snapchat accounts are geared almost entirely toward my friends.
The majority of posts on these platforms deal with my life and engage with my friends, having barely any content dealing with public relations on these platforms.
My Pinterest account and my blog are split between my two audiences.
On Pinterest, about half the pins I choose relate to public relations, content development and social media while the other half of my pins relate to my fandoms and hobbies. My followers on Pinterest can easily opt out of seeing the boards they do not care to see, and will then be presented with a steady stream of content that interests them.
At the same time, my blog alternates between posts for and relating to class and posts dealing with current movies, projects, recipes, etc. My blog leans more heavily toward engaging with my friends except when I am blogging for a class, in which case the opposite is true.
I am not active on Google+ or YouTube.
I mainly use those platforms to see other content and not to share my own content.
Third: How do I appear?
When I search my name in Google, Bing and Yahoo, I immediately appear.
All of the posts and pictures on the front page of those searches, and the majority of the following two or three pages, are content that I have posted on the internet.
If someone searched for me, they would be able to easily find my social media accounts, and no compromising or embarrassing content, which I do not post to begin with.
Although the image results from these searches quickly devolve into images that I have pinned or that aren’t related to me, the first few images are consistently my profile pictures.
Among other Google Alerts I have set up, I have alerts set for “lydia
clinkscales
” and “lydiaclink
.” Although the only notifications I receive from these alerts are of content that I have recently shared, it is reassuring to know that I would quickly find out if something else was posted about me.
My Klout score has consistently stayed in the 55 to 57 range throughout this semester.
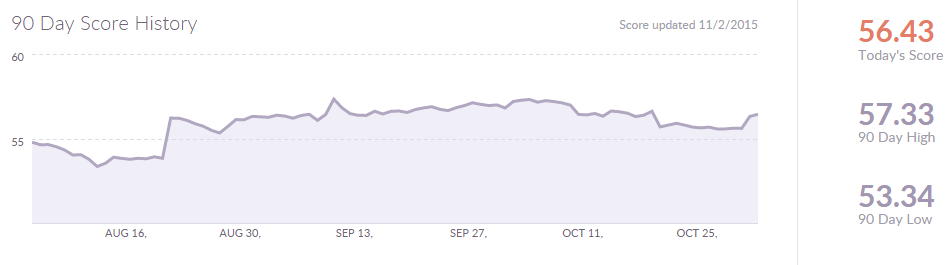
Before this semester, my score was consistently in the 53 to 55 range during the summer.
There was a clear improvement in engagement when my friends returned from summer break.
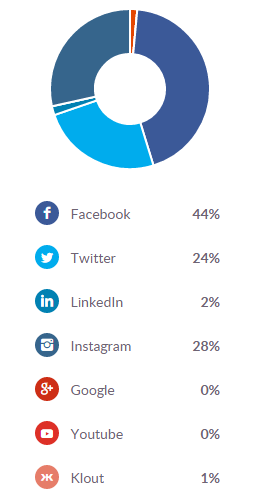
The majority of my engagement and influence takes place on Facebook, Twitter and Instagram.
As this pie graph from Klout shows, over a third of my engagement takes place on Facebook.
Instagram and Twitter are the second and third platforms that I am most influential on.
I have tiny slivers of influence on LinkedIn and Klout, and none on Google+ and YouTube, which makes sense as I am not active on those accounts.
My blog is not very popular, as I am still trying to solidify the main goal of my blog. I am currently building up the amount of content I have on the blog, and once I find my actual niche, I will increase my promotion.
Page views of my blog were at an all-time high in March 2015, with the inconsistency of my posting reflected in the inconsistency of page views.
While I tend to cross-post content across platforms well, there are not many calls to action.
(Why is that important? Check out my blog about it).
Because most platforms have space for one website link, my accounts direct traffic toward my blog of my website.
My website hosts my blog and directs people out to my social media accounts, but if people do not take the extra step of looking at my website, they may need to use google search to find my other accounts.
Fourth: What should I focus on?
Here are six goals I want to focus on and how I plan on accomplishing them
1. Establish my blog as a credible source of information
-> Create a bank of content that I can work from to share content at consistent times
-> Narrow down the topics I cover on my blog, so the content itself will be more consistent
-> Interact with other bloggers with curated content and guest posts
2. Present a more consistent image of myself across platforms
-> Update information on all accounts at the same time
-> Blend the tones I use to interact with my two audiences, to present a consistent tone
-> Use more calls to action that connect my social media accounts
3. Engage both of my audiences more equally across social media platforms
-> Engage with content that is both fun and professional at the same time
-> Cross-post across all platforms when the format is applicable

4. Be able to present my social media accounts as my resume when applying for a job
-> Consistently update my bio and about sections on all platforms
-> Curate my older content to remove broken links and incorrect information
5. Have a more influential voice on Twitter
-> Engage with brands on a consistent basis
-> Look for relevant conversations that I can engage with
6. Increase my engagement with followers
-> Post more interesting content across my social media accounts
-> Use calls to action in the majority of my posts to guide audience interaction
Off to check my social media accounts,
The Purple Writer